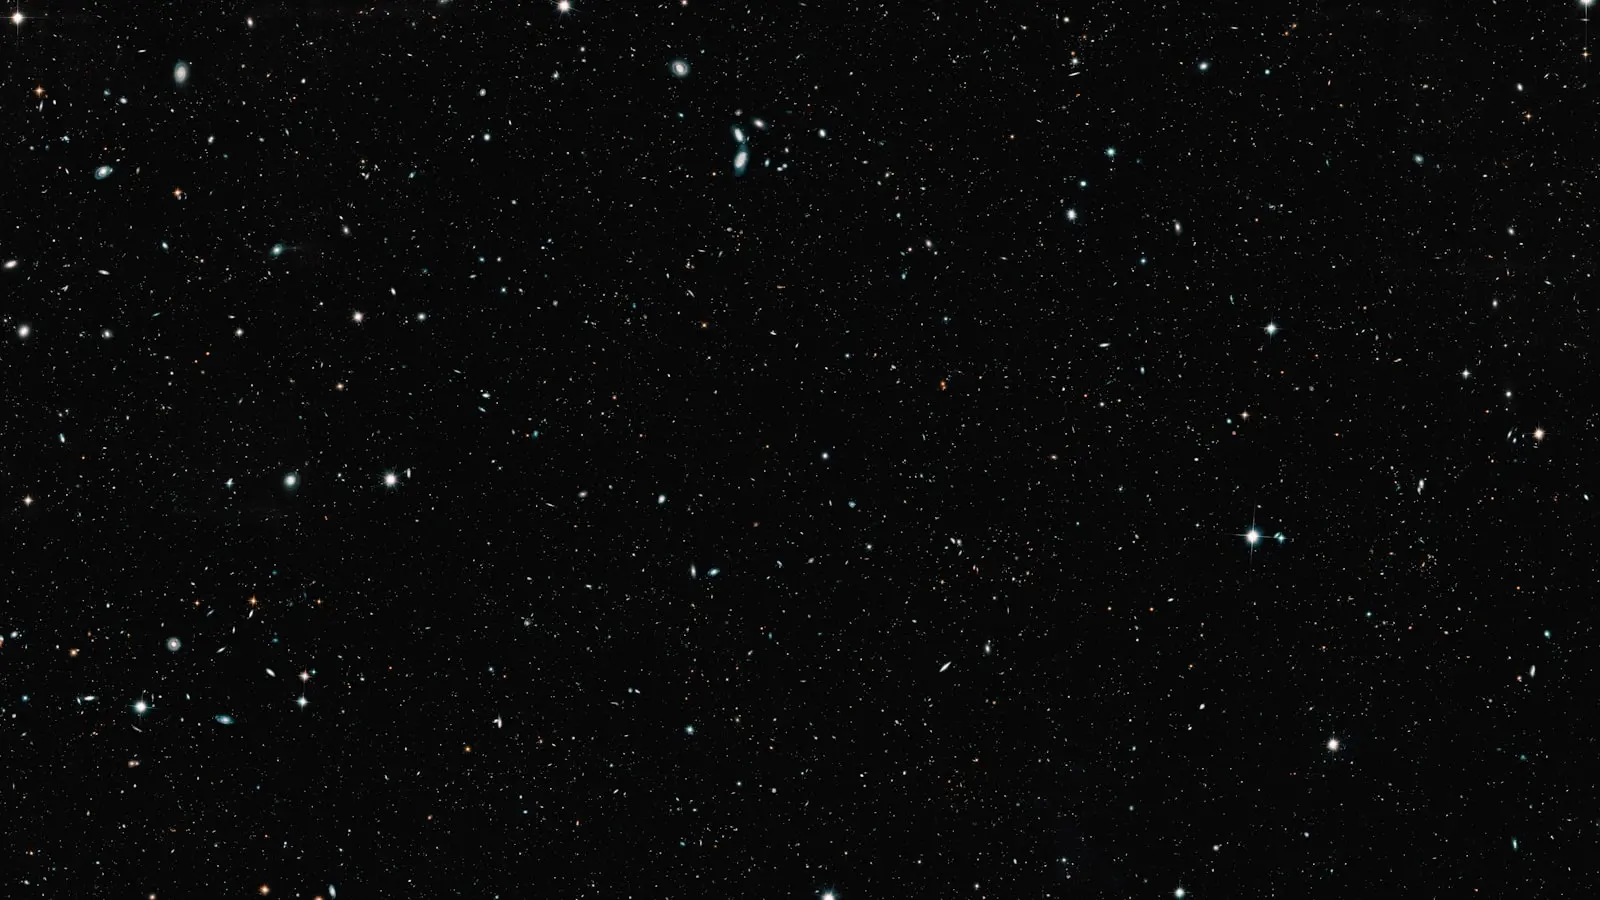
The first telemetry packets downloaded from the James Webb Space Telescope strike the servers at the Space Telescope Science Institute not as swirling cosmic landscapes, but as invisible numerical matrices. The gold-plated beryllium mirrors capture light residing entirely outside the human visual spectrum. Every neon nebula and glowing galaxy plastered across screens worldwide originates as raw, monochromatic infrared telemetry. The data contains zero visible color whatsoever. Astronomers process this invisible data by forcefully mapping specific infrared wavelengths into the visible spectrum. The public receives a highly edited translation.
To understand the visual output of the world’s most advanced astronomical observatory, analysts must first strip away the aesthetics. The telescope operates primarily across the near-infrared and mid-infrared spectrums, detecting wavelengths stretching from 0.6 to 28.3 microns. Human eyes hit a biological wall at roughly 0.7 microns, the edge of deep red light. If astronomers bypassed the imaging processors and handed the raw telescope files directly to the public, monitors would simply display varying shades of grey or absolute black. To make the data legible, processing teams execute a rigid mathematical translation.
Astronomers stack multiple black-and-white infrared exposures captured through distinct optical filters. They apply a chronological color assignment protocol called chromatic ordering. The shortest infrared wavelengths captured by the sensors acquire blue. Mid-range wavelengths acquire green. The longest wavelengths acquire red.
This mapping process creates the final composite image.
The Mechanical Need for Infrared Sensors
The decision to abandon visible light optics entirely traces back to specific cosmological barriers. The universe operates behind a shroud of cosmic dust. When traditional optical observatories attempt to photograph dense star-forming regions like the Pillars of Creation, visible light hits microscopic soot particles and stops. The image registers only a dark silhouette.
Infrared light features longer wavelengths that slip past these microscopic dust grains entirely. The telescope peers through the barricade. By tracking thermal radiation rather than optical reflection, the observatory maps the heat signatures of protostars forming deep within dark nebulae.
Time and space dictate the telescope’s core architecture. The universe expands continuously, stretching the fabric of space and everything traveling through it. A photon emitted by a primordial galaxy 13.5 billion years ago begins its journey in the energetic ultraviolet spectrum. As space stretches over billions of years, the photon stretches alongside it. The wavelength elongates. Ultraviolet drops into visible blue, cascades down through the visible spectrum into red, and eventually crosses entirely into the infrared domain.
Astronomers label this mechanical stretching cosmological redshift.
(You cannot observe the early universe without infrared sensors). If an observatory searches for the first light emerging after the Big Bang using optical cameras, it will find absolutely nothing. The light has abandoned the visible spectrum entirely.
Mapping Chemistry Through False Color
The chromatic translation process provides significantly more than visual engagement. It functions as a precise topographical map of galactic chemistry. When an image shows a bright blue core surrounded by rusty red tendrils, scientists read a chemical signature.
The color gradients reveal temperature dynamics, gas density, and star formation rates. Different elements and molecules emit distinct infrared signatures when heated by stellar radiation. By isolating these specific emission lines with narrowband filters, astronomers pinpoint the exact location of complex hydrocarbons, ionized gases, and molecular dust.
| Element or Molecule | Wavelength Filter (Microns) | Assigned Visible Color | Astronomical Implication |
|---|---|---|---|
| Ionized Oxygen | 0.7 to 1.5 | Blue | Intense ultraviolet radiation from young stars |
| Molecular Hydrogen | 2.12 | Green | Shockwaves from stellar jets colliding with gas |
| Polycyclic Aromatic Hydrocarbons | 3.3 to 7.7 | Red | Complex carbon molecules forming dust lanes |
| Silicate Dust | 10.0 to 18.0 | Deep Red | Planetary formation zones around mature stars |
Data drives the color selection. A ten-billion-dollar machine does not exist to produce desktop wallpapers. The vibrant blues and reds delineate boundaries between violent stellar nurseries and dead zones of cold gas. The assigned colors allow researchers to visually differentiate specific elements like hydrogen, sulfur, and oxygen colliding across distances large enough to swallow our solar system thousands of times over.
The Friction of Public Perception
When science agencies release these composite images, friction inevitably builds within public forums. Online communities frequently debate the philosophical nature of these visuals. Users express distinct disillusionment upon realizing the Carina Nebula would not look like a fiery orange mountain range out the window of a spacecraft. Accusations of deception occasionally surface, driven by the assumption that false color equates to fake data.
(People demand a reality their retinas physically cannot process).
The semantic gap between “false color” and “fake” creates this friction. False color is not fiction. It remains a strict, mathematically proportioned representation of physical reality. The telescope records legitimate photon strikes. The intensity, structure, and distribution of the light are entirely real. The translation merely shifts the data up the electromagnetic spectrum into a frequency human biology can parse.
Consider the precedent of false color in modern astronomy. The Hubble Space Telescope operates largely in the visible spectrum, yet astronomers still utilize artificial color mapping for its most famous captures. The iconic “Hubble Palette” specifically isolates sulfur, hydrogen, and oxygen emissions, assigning them to red, green, and blue channels respectively. Even when capturing visible light, scientists manipulate the color channels to isolate chemical data.
Translating the Invisible
The insistence on literal visual accuracy ignores the fundamental mechanics of space observation. Human vision evolved to navigate the surface of a terrestrial planet illuminated by a specific yellow dwarf star. Our eyes detect a razor-thin slice of the electromagnetic spectrum. The universe does not restrict its operations to that narrow band.
If astronomers restricted their visualizations to what the human eye natively sees, the vast majority of the cosmos would remain entirely dark. Black holes actively tearing apart neutron stars, the thermal glow of rogue exoplanets drifting between star systems, and the redshifted light of the universe’s oldest galaxies all exist outside our visual capacity.
The James Webb Space Telescope does not function as a traditional camera. It operates as a highly specialized light bucket, capturing invisible data points across millions of miles of void. The subsequent colorization process stands as a necessary translation. Discovery requires legibility. By mapping the invisible into the visible, scientists pull the hidden architecture of the universe into the light.