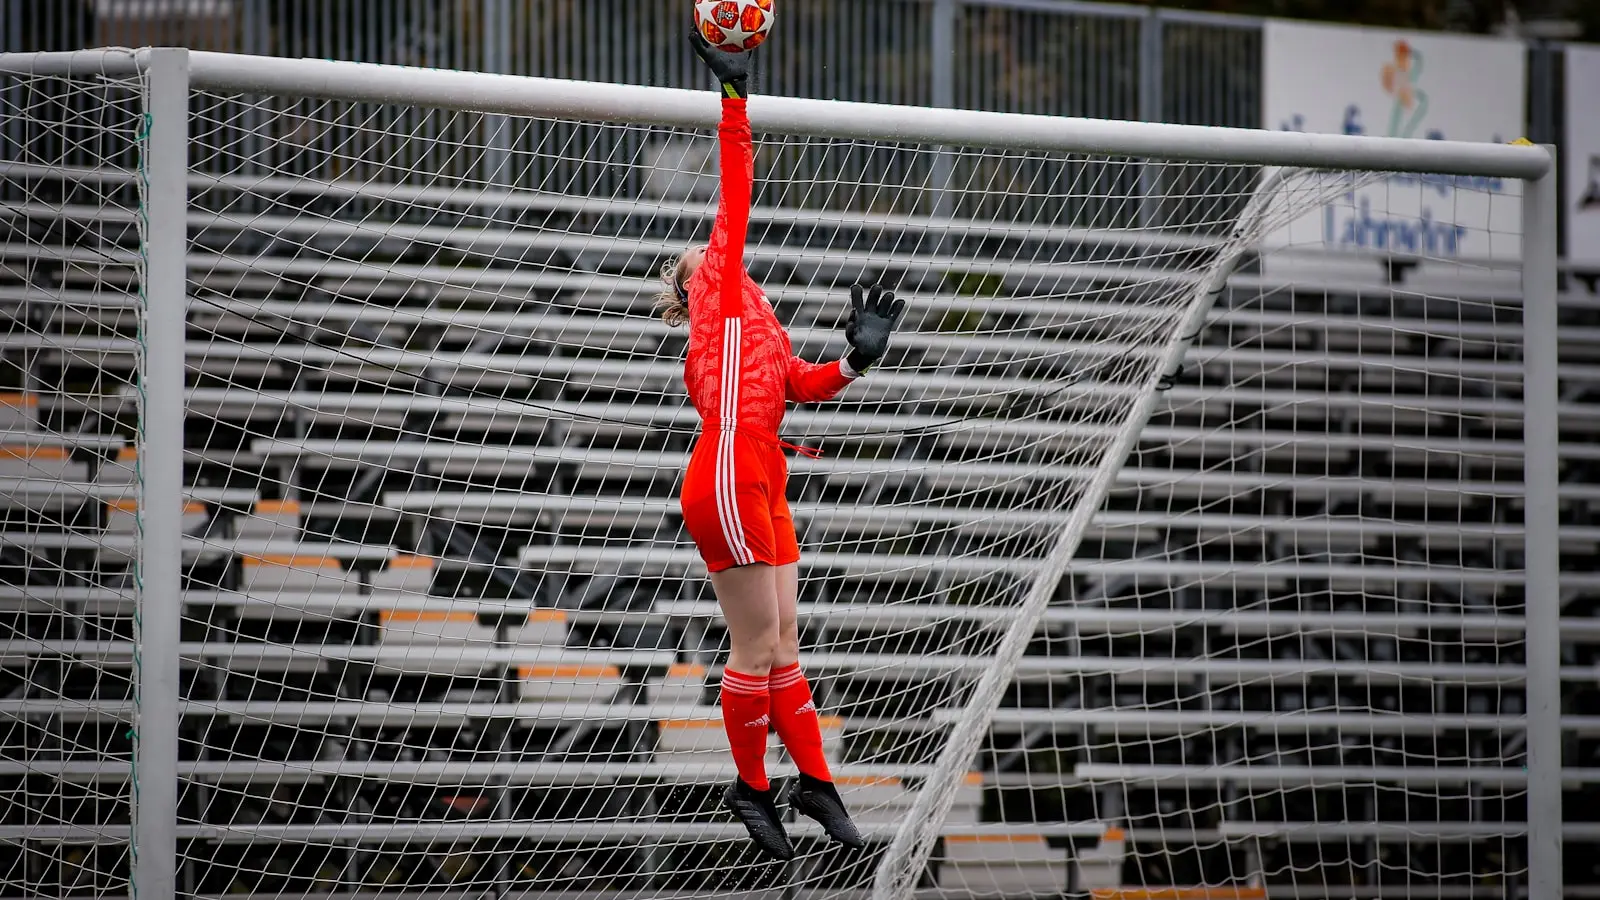
A goalkeeper can concede several goals and still play well. Goals conceded are a team outcome: they reflect the quality of chances allowed, defensive errors, finishing, tactics and the goalkeeper’s own actions.
Expected goals goalkeeper analysis helps separate those elements. Pre-shot xG describes the chances a defense conceded; post-shot expected goals adds context about the shot that actually reached goal. Save percentage provides a simple outcome measure, while video helps explain the decisions and circumstances behind each chance.
Key Takeaways
- Goals conceded and clean sheets matter, but neither isolates goalkeeper performance.
- Pre-shot xG measures the danger of a chance before the shot, so it is more useful for judging chance prevention than shot stopping.
- Post-shot expected goals can provide better context for saves, but definitions and calculations vary by provider.
- Save percentage is easy to read but does not account for how difficult individual shots were.
- The fairest verdict combines metrics with video, tactical context and a meaningful sample of matches.
Why Goals Conceded Can Mislead When Judging a Goalkeeper
Goals conceded and clean sheets decide matches, but they are weak standalone soccer keeper statistics. They combine the work of the goalkeeper, defenders, midfield pressure, tactical setup and the quality of the opponent’s finishing.
Consider two hypothetical matches. Keeper A concedes three goals after cutbacks, close-range finishes and breakaways caused by defenders losing runners. Keeper B concedes once from a low-danger shot from distance that reaches a saveable area of the goal.
The scoreline says Keeper B conceded fewer times. An individual performance review could still rate Keeper A more highly if the three goals came from chances that gave the keeper little realistic opportunity to intervene.
Defensive breakdowns can transform the goalkeeper’s task. A one-on-one, a close-range rebound or a shot through a crowded penalty area may leave little time to set, react or see the ball clearly. Conceding in those situations does not automatically indicate an avoidable error.
The reverse is also true. A goalkeeper behind a dominant defense may face very little action, keep a clean sheet and still make a poor decision that stronger opposition might have punished. Low involvement is not the same as high-quality performance.
The first question, then, is not simply how many goals a keeper allowed. It is what type of chances the team allowed, and whether the goalkeeper made the saves that were reasonably available.
Pre-Shot Expected Goals Explain the Chances Allowed
Pre-shot expected goals, usually shortened to xG, estimates the likelihood of a goal before the shot is taken. Models commonly consider factors such as shot distance, angle, body part, assist type, set-piece context and whether the chance resembles a penalty or fast break.
In simple terms, pre-shot xG asks: how dangerous was the opportunity created? A close-range attempt after a pass across the face of goal will usually be assigned a higher probability than a speculative shot from distance at a narrow angle.
That makes pre-shot xG useful for evaluating the volume and quality of chances a team allowed. If defenders repeatedly permit opponents to receive the ball near goal, the goalkeeper is likely to face difficult situations regardless of their individual level.
Regular xG does not directly measure shot stopping, however. It cannot fully account for whether the final shot was placed in the corner, hit weakly at the goalkeeper, deflected off a defender or struck while the keeper’s view was blocked.
It also cannot settle whether the goalkeeper’s starting position made a save easier or harder. A keeper who concedes roughly in line with pre-shot xG may have faced dangerous chances, but that is context rather than a verdict on technique or decision-making.
Post-Shot Expected Goals and Goals Prevented
Post-shot expected goals evaluates a shot after it has been struck. Depending on the data provider and the information available, it may incorporate where the ball was directed within the goal and other details recorded after the attempt.
The distinction between the two measures is important:
- Pre-shot xG: How dangerous was the chance before the finish?
- Post-shot expected goals: How difficult was the shot to save after its execution?
A chance can have modest pre-shot xG but become a very difficult save if the attacker places the ball accurately into a corner. Conversely, a high-value chance can result in a more manageable save if the shot is weak or directed centrally.
This is why post-shot expected goals is often more useful for evaluating shot stopping. It can help distinguish between a keeper beaten by excellent finishing and one conceding from shots the model considers more saveable.
A related measure is often called goals prevented. A simple version compares post-shot xG faced with goals conceded:
Post-shot xG faced minus goals conceded = goals prevented
If a goalkeeper faces 2.4 post-shot xG and concedes one goal, the difference is +1.4. Within that model, the keeper stopped more than expected. If the keeper concedes three from 2.4 post-shot xG, the difference is -0.6, meaning goals allowed exceeded the model’s expectation.
The label and exact formula can vary. Some providers use different terminology or handle unusual events differently, so comparisons are most useful when they come from the same data set. A positive total suggests above-model shot stopping; it does not prove that the goalkeeper was excellent in every part of the match.
Post-shot models also depend on event coding and model design. The detail available on shot placement, deflections and other conditions is not standardized across every source. That makes cross-provider comparisons less certain than they can appear.
Save Percentage, Sample Size and Public Metric Limits
Goalkeeper save percentage is usually calculated as saves divided by shots on target faced. It is intuitive and useful for describing outcomes, although data sources may treat penalties and unusual events differently.
Its main weakness is that it groups very different shots together. A keeper may face several soft efforts from distance in one match, then a handful of close-range attempts with little chance of a save in another. The raw percentage does not explain that difference.
Save percentage can also swing sharply over short periods. A deflection, penalty, exceptional finish or obvious handling mistake can substantially alter a goalkeeper’s numbers across only a few matches. One-game xG goalkeeper analysis should therefore be cautious rather than definitive.
The most useful comparisons stay within the same competition, season and data provider. Larger samples are more likely to reveal meaningful patterns, although even a season of data cannot perfectly divide responsibility among goalkeeper, defenders and tactical system.
Public goalkeeper metrics have further limits. They may not capture every screen, deflection, pressure detail or goalkeeper movement visible on match footage. More detailed internal data may exist in some environments, but different models are not automatically comparable.
No statistic can assign complete responsibility for every goal. The value of the numbers is that they improve the questions asked during review.
How to Combine Expected Goals Goalkeepers Metrics With Video
A practical review follows an order rather than relying on one headline number.
- Check pre-shot xG to understand the quality and volume of chances the defense allowed.
- Check post-shot expected goals, or an equivalent provider measure, to add context about the shots that reached goal.
- Compare goals conceded with the relevant expected-goals total, treating the gap as a prompt for review rather than proof.
- Watch the decisive sequences to assess responsibility, technique and repeatable behavior.
Video can show what numbers may miss or model imperfectly. Review whether the goalkeeper was set before the strike, whether a defender blocked their view, whether an initial save created a dangerous rebound and whether a catch, parry or reset was realistically possible.
It also reveals responsibilities beyond shot stopping. Goalkeepers influence matches through claiming crosses, commanding the penalty area, sweeping behind the defense, distributing under pressure and communicating with teammates. A strong shot-stopping figure does not automatically mean strong all-round goalkeeping.
Tactical context matters too. A team with a high defensive line may ask its goalkeeper to operate far from goal and deal with passes played behind defenders. That role can create more breakaway risk and difficult decisions that do not fit neatly into a shot-based metric.
For a single match, focus on the actual sequences and individual decisions. For a season-long assessment, look for repeatable trends across a larger sample and include several areas of goalkeeper performance.
A useful match-viewing checklist is:
- Were the conceded chances high quality before the shot?
- Were the shots especially well placed after they were struck?
- Did the goalkeeper prevent, create or worsen danger through positioning, handling or decision-making?
- What did the defense and tactical setup contribute?
- Is this one unusual game or part of a consistent pattern?
FAQ Expected Goals and Goalkeeper Evaluation
Can a goalkeeper play well after conceding three goals?
Yes. Three goals can result from high-quality chances, defensive errors, close-range finishes or excellent shot placement. The key issue is whether the keeper had realistic opportunities to make more saves and whether their actions otherwise reduced danger.
Is post-shot expected goals better than regular xG for goalkeepers?
It is often more directly relevant to shot stopping because it evaluates the shot after execution. Regular xG remains important because it explains the quality of chances the defense allowed, while post-shot measures do not fully capture crosses, sweeping, distribution or communication.
What is a good goalkeeper save percentage?
There is no universal benchmark. Competition level, shot difficulty, penalties, data definitions and sample size all affect interpretation. Compare goalkeepers in similar contexts and use save percentage alongside expected-goals measures and match video.